Are you new to MS Excel? And do you want to know how to calculate upper and lower bounds in Excel? Microsoft Excel is arguably the best spreadsheet program that can be used to calculate, format, organize, and analyze, etc. data. Honestly, this is a very advanced data analytics tool. And, for new users, it can be both overwhelming and intimidating. There are a whole lot of features and functions this powerful spreadsheet program comes with.
For instance, with MS Excel, you can find out the upper and lower bounds with ease. However, you might not be aware of the steps to follow to find out that data. If you are looking for an answer to this question, we have got your back. Because in this post, we will be telling you how to calculate upper and lower bounds in excel in a step by step manner. You will also find screenshots added to the guides, so it will be easier to follow.
So, if you are ready, let’s jump right in…
Tutorial on How to Calculate Upper and Lower Bounds in Excel
In the following section of this post, you will find the tutorial on how to find the lower and upper bounds using Excel. We have divided this tutorial into multiple parts and steps to make it easier to digest for our readers. So, you can follow the guides sequentially in the following section. This might look like a tough task to perform, but we can assure you that it is very easy.
Part #1 Enable the Analysis ToolPak:
In this section, we will show you how to enable the ‘Analysis ToolPak’ add-in in MS Excel. This is an add-in that comes built-in to Excel. However, it is not enabled by default. Thus, you have to enable it manually. But don’t worry, it is very easy to enable the Analysis ToolPak add-in.
Again, for some of you, this add-in might be already enabled. If that is the case for you, you can skip this part, and keep reading on from Part 2 down below. Now, let’s go…
- Launch Microsoft Excel on your PC
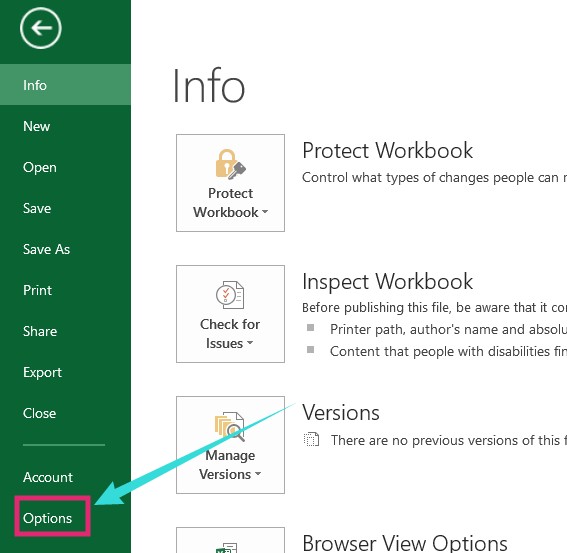
- Now, click on the ‘File’ option from the top menu bar
- In doing so, you will be taken to a new page. From there, click on the ‘Options’ button from the left sidebar of the screen
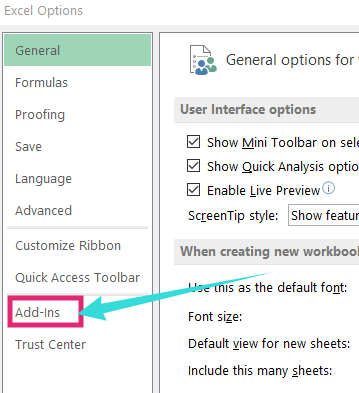
- Now, a new window i.e. the ‘Excel Options’ window will appear. So, click on the ‘Add-Ins’ button from the left sidebar on that window
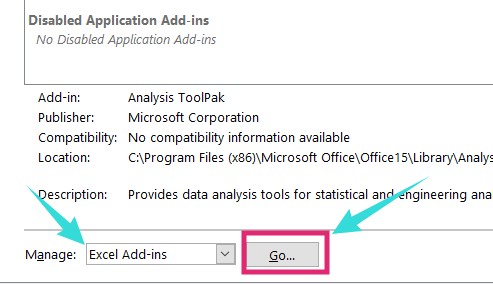
- After that, you have to click on the ‘Go…’ button from next to the ‘Manage:’ dropdown menu. Also, make sure the ‘Excel Add-Ins’ option is selected in the dropdown menu
- In doing so, the ‘Add-Ins’ window will open up
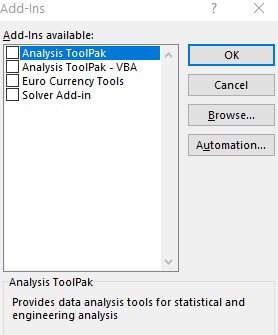
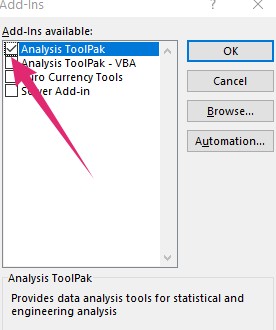
- Next, put a checkmark next to the ‘Analysis ToolPak’ option by clicking on it
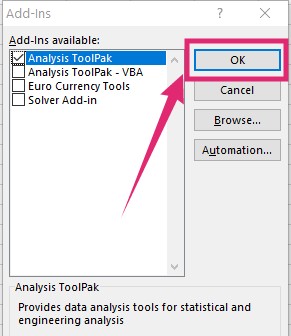
- Finally, click on the ‘OK’ button from the right side to save the changes
That is it. Now, you have enabled the ‘Data Analysis’ tool in MS Excel. Now we can proceed to the next part.
Part #2 Calculating the Upper & Lower Bounds in MS Excel:
In this section, we will show you how to calculate the upper and lower bounds in Excel. There are various ways you can calculate the upper and lower bounds. However, we are going to show you one of the simplest and reliable ways. For the record, that would be by constructing a confidence interval and then finding the upper and lower bounds with ease on Excel. So, let’s get started…
Step #1 Using the Data Analysis Tool
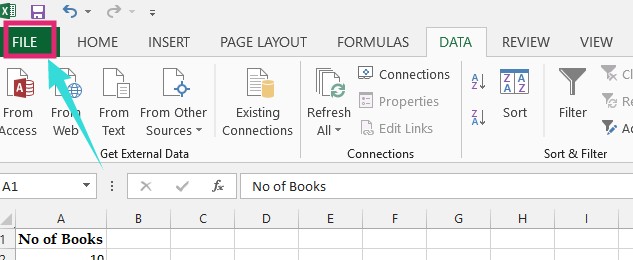
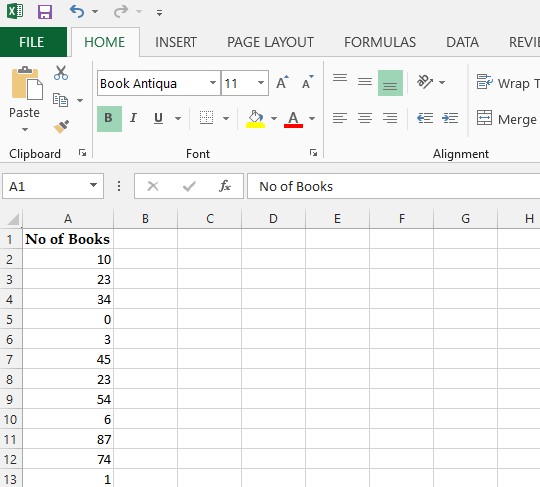
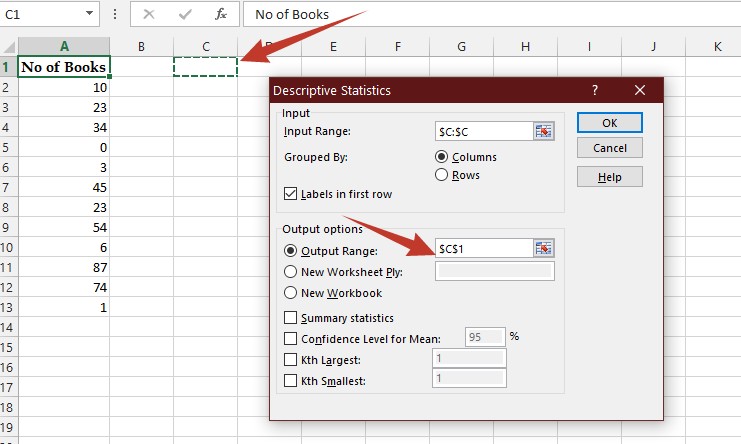
- First, open MS Excel and load the data that you want to find the upper and lower bounds from. In our case, we have got a list of the number of books where the column title is ‘No of Books’
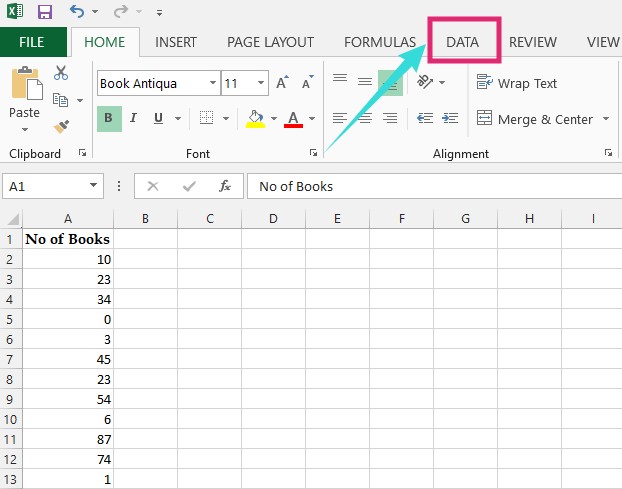
- Now, click on the ‘Data’ button from the top menu bar
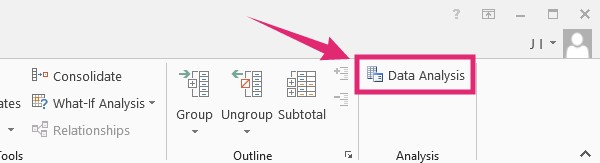
- In doing so, the ‘Data’ related options will appear in the top bar. At this moment, you have to click on the ‘Data Analysis’ option from the top right corner of the Excel window
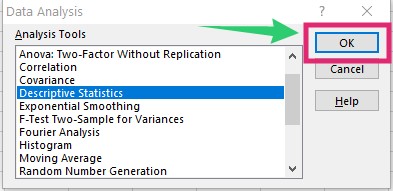
- After that, you will see the ‘Data Analysis’ window will appear. From that window, click on the ‘Descriptive Statistics’ option and highlight it
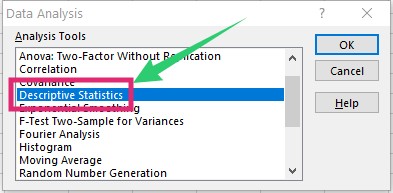
- Next, click on the ‘OK’ button from the right corner of the window
Step #2 Working with the ‘Descriptive Statistics’ Options:
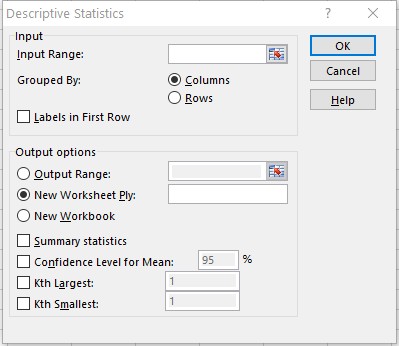
- In doing so, the ‘Descriptive Statistics’ option will appear. Here you have a few tasks to perform. We will share them one by one
#First:
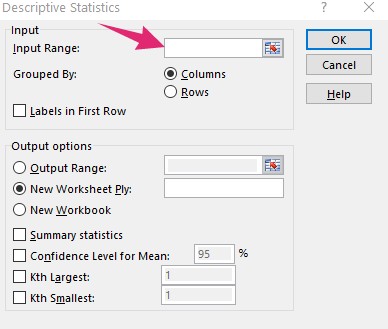
- First of all, you have to select the ‘Input Range’. To do so, you have to click on the blank box next to the ‘Input Range:’ option
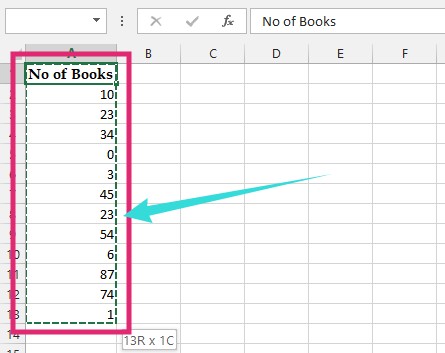
- When you click on the box, the window will disappear and the data you have opened on Excel will appear. Now, you have to highlight all the data on the spreadsheet you need to find the upper and lower bounds from
- To do that, you have to click and hold the mouse cursor from the top of the column including the column heading; and then drag the mouse cursor to the bottom of the column where the data ends. In our case, it was from the ‘No of Books’ to ‘1’. You will see a selection box while holding and dragging the mouse cursor over the data. Once you have selected the data just let go of the mouse cursor
#Second:
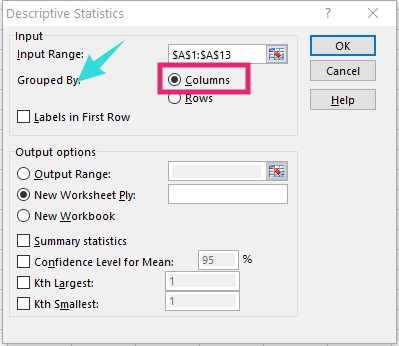
- Then the previous window will reappear. Here, make sure that you have the ‘Columns’ option selected next to the ‘Grouped By:’ option
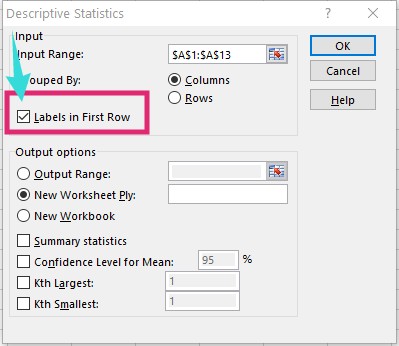
- Also, you have to put a checkmark next to the ‘Labels in First Row’ option
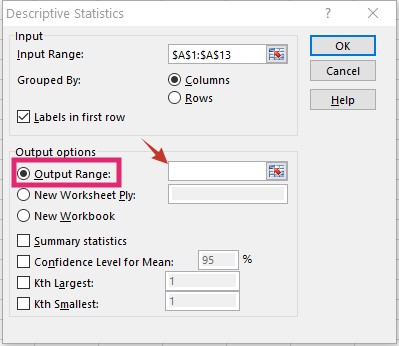
- Now, click on the ‘Output Range:’ box and the window will again disappear. Because now, you have to select the cell where you want the analyzed data to appear in the spreadsheet
- So, click on the preferred cell of yours. For example, we have selected the ‘C’ In doing so, the ‘Descriptive Statistics’ window will reappear
#Third:
- However, now, you will notice that both the ‘Input Range’ and ‘Output Range’ box is full with some information. Next, you have to put checkmarks next to the ‘Summary statistics’ and the ‘Confidence Level for Mean:’ Here, we are keeping the ‘Confidence Level for Mean’ to ‘95%’ as it works great as the confidence interval in our case. You can set your preferred ‘Confidence Interval’ percentage as well
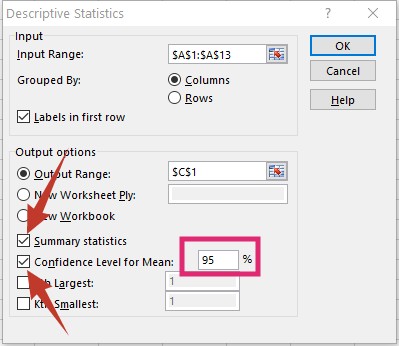
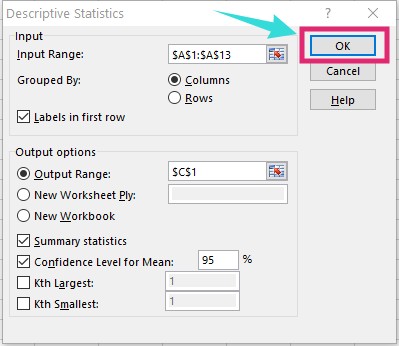
- Then click on the ‘OK’ button from the top right corner of the window
Step #3 Finding out the Confidence Level:
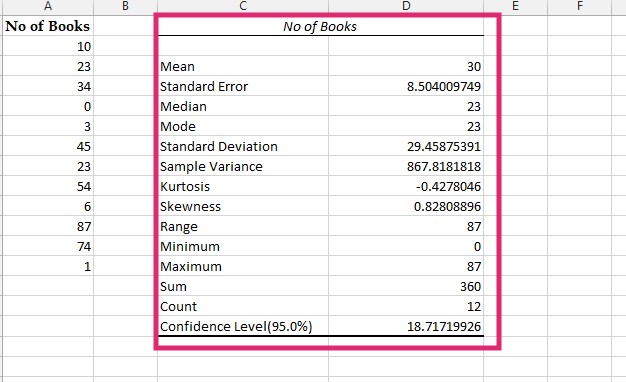
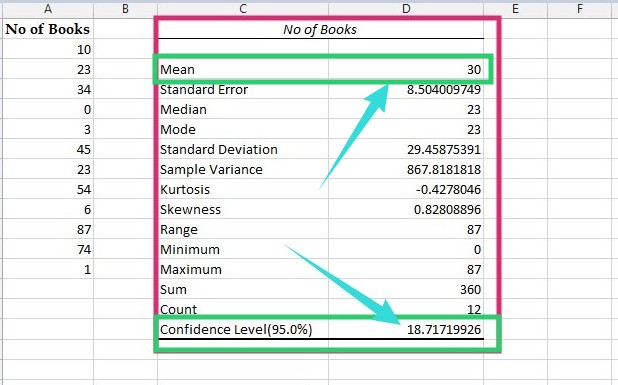
- In doing so, the window will disappear. And the newly analyzed data will appear in the spreadsheet. You will find that data in the particular cell you have specified earlier for our case, it is the ‘C’ You can extend the margin of the cell to see the data more easily and clearly
- Now, at the bottom row, you will find the ‘Confidence Level’ of all of these data. Also, at the top, you will find the ‘Mean’ You can use both of these value to calculate the upper and lower bounds in Excel
Step #4 Calculating the Lower and Upper Bounds:
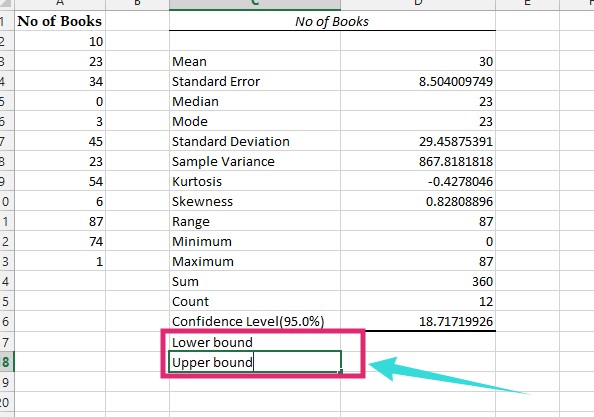
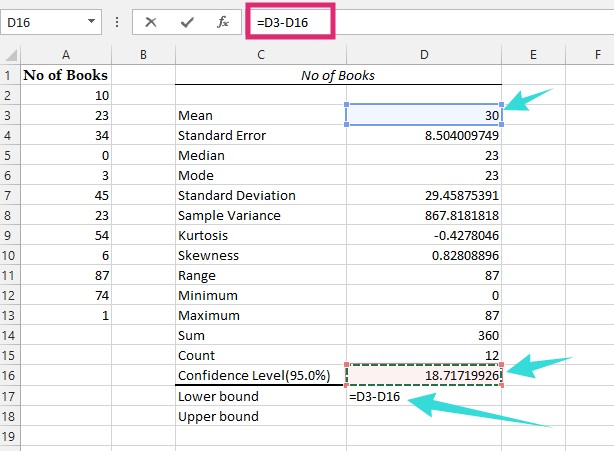
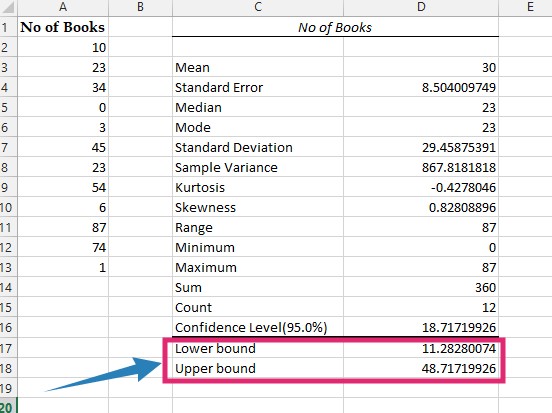
- So, type in the word ‘Lower bound’ just right below the ‘Confidence Level (95%)’ And then type in the word ‘Upper bound’ right below the ‘Lower bound’ row and press ‘Enter’ key on the keyboard
- Now, to find the lower bound, you have to subtract the ‘Confidence Level’ from the ‘Mean’. So, the formula would be (Confidence level-Mean), in our case, it was (D3-D16). Another way of subtracting would be to type in the ‘=’ (Equal sign) and click on the ‘Mean’ value; then type in the ‘-’ (subtraction sign) and click on the ‘Confidence Level’ value (The result would be on the blank row next to the ‘Lower bound’ row). Finally hit the ‘Enter’ button on the keyboard
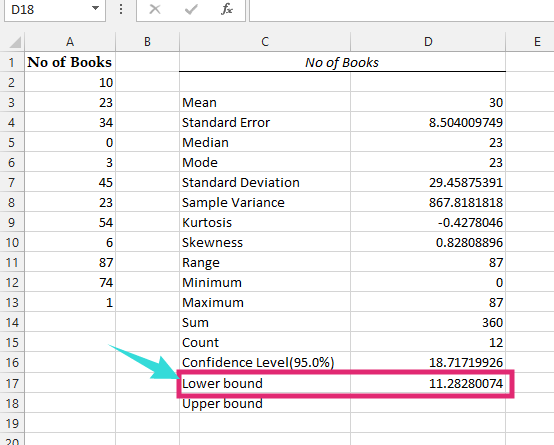
- As a result, the ‘Lower bound’ will appear shortly
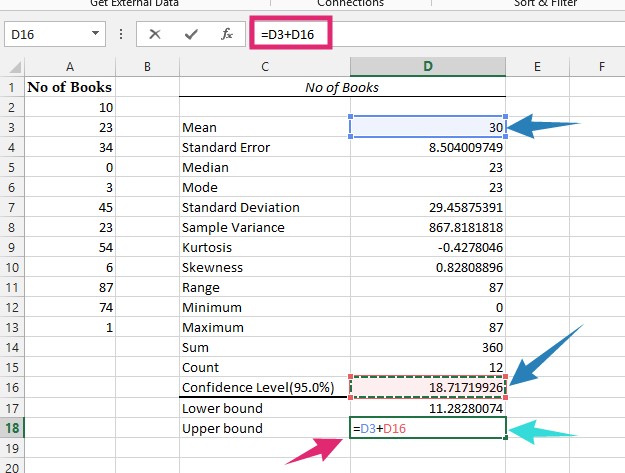
- Next, for calculating the upper bound, you have to add the ‘Mean’ and the ‘Confidence Level’. So, enter the required equation for that addition calculation. In our case, it was (D3+D16). Or you could also type in the ‘=’ (Equal sign) and click on the ‘Mean’ value; then type in the ‘+’ (Addition sign) and click on the ‘Confidence Level’ value (the result would be on the blank row next to the ‘Upper bound’ row). Next press the ‘Enter’ key on the keyboard
- Shortly, the ‘Upper bound’ result will also appear
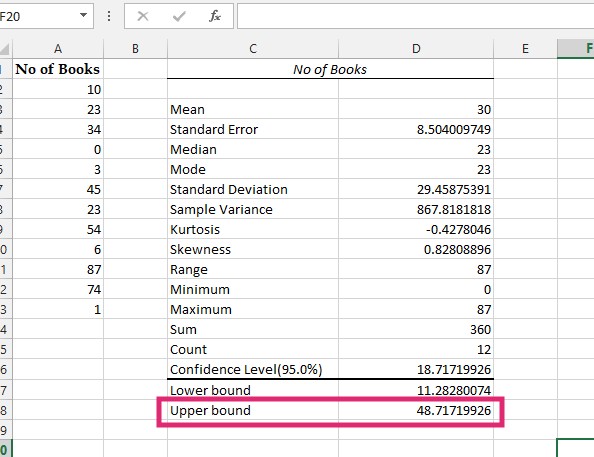
- Congratulations, now, you know how to find the upper and lower bounds using the confidence interval in MS Excel
The Final Words: Calculate Upper and Lower Bounds in Excel
Are you still with us? Then you can give yourself a pat on the back. Because you have learned how to calculate upper and lower bounds in Excel. We have tried to make sure that the tutorial is easy to follow. Thus, we have divided it into several parts. And, if you have followed the tutorial in the correct order, you can now find the lower and upper bound yourself using the confidence interval in MS Excel without any issues. We hope this tutorial will come in handy in the near future.
So, do you like to use MS Excel? And have you found this tutorial useful? You can share your thoughts with us by leaving your comment in the comments section down below!